- Home
- About
- Stakeholders
- Projects
- Water
- Evaluating reservoir operations and the impacts of climate change in the Connecticut River Basin
- Collaborative development of climate information for the Connecticut River Basin using Shared Vision Forecasting
- Impacts of climate change on the Massachusetts Water Resources Authority water supply system
- Climate information for water harvesting and re-use strategies in urban settings
- Delaware River streamflow reconstruction using tree rings
- Coasts
- Health
- Cross-cutting theme: Climate
- Cross-cutting theme: Vulnerability/Evaluation
- Water
- Library
- Resources
- Seminars
- Contact Us

Global Climate Change
Global climate change refers to a change in average weather conditions on Earth, including changes in temperature, precipitation, and wind patterns. Although the planet’s natural greenhouse effect helps to maintain a livable temperature, scientists have observed significant changes in mean temperature over long periods of time. They call these events glacial and interglacial periods.
The natural greenhouse effect has been exacerbated by anthropogenic (human) activity over the past century. Activities such as the burning of fossil fuels and deforestation have led to an increase in carbon dioxide (CO2) and other greenhouse gas emissions. As the human demand for more energy and resources grows alongside an increase in population and industrialization, this intensified greenhouse effect will lead to extreme variability in climate, most noticeably with precipitation and temperature. In order to understand the significance of climate change in the urban Northeast, we must understand the scientific foundations of global climate change; its causes, its history, its significance and the methods used to make such projections.
Please click on the questions below to expand and collapse their answers.
What causes global climate change?
There is a scientific consensus that concentrations of greenhouse gases in the atmosphere are increasing and that this is causing global climate change. These changes result from both internal processes and natural or human-driven forces. Anthropogenic emissions of carbon dioxide and other greenhouse gases for industry, power, and transportation, and land-use change for agriculture and forest products are the processes primarily responsible for the increase. Average emissions have grown 70% between 1970 and 2004. This was confirmed in February 2007 during the Intergovernmental Panel on Climate Change (IPCC) where leading climate scientists agreed with more that 90% certainty that the Earth is warming and that human activity is the first offender. Emissions of black carbon (soot) may also be contributing to the warming, and emissions of reflective sulfate aerosols have been associated with a net cooling effect. Climate change could naturally occur as a result of a change in the sun’s energy or Earth’s orbital cycle. The climate system includes a great deal of natural variability, and climate fluctuations have always been part of the Earth’s 4.6 billion year history. However, over the past century changes in concentrations of greenhouse gases in the atmosphere are of an extraordinary rate and magnitude. Scientists believe that these changes may have already begun to alter the global climate.
Regardless of the cause, these occurrences result in climate variability which are variations in climate on all temporal and spatial scales beyond that of individual weather events. It is important to distinguish between weather and climate. Weather refers to a singular state of the atmosphere. Examples of weather elements include precipitation, temperature, humidity, storms, and winds. Climate speaks of long-term, regional weather patterns. Global climate change indicates a change in either the mean state of the climate or in its variability, persisting for several decades or longer. This includes changes in average weather conditions on Earth, such as a change in average global temperature, as well as changes in how frequently regions experience heat waves, droughts, floods, storms, and other extreme weather. It is important to note that changes in individual weather events will potentially contribute substantially to changes in climate variability, and possibly result in lasting altered conditions.
The Human Factor
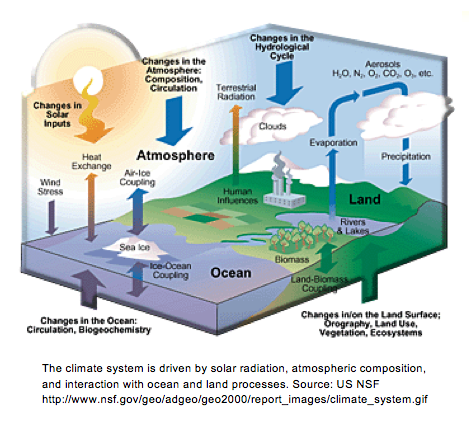
The climate system is driven by the sun’s energy and regulated by natural processes and cycles in the Earth system, moderating temperature. Humans are principally affecting the climate system through alterations to the carbon cycle, which regulates the flow of carbon among living and non-living parts of the Earth system. Carbon is found in all living things, in soils and rocks, in fossil fuels, in marine sediments, and in the atmosphere as carbon dioxide. Each of these carbon reservoirs stores a percentage of the Earth’s total carbon and the carbon moves at varying rates among the reservoirs. In some cases, the carbon may remain in a reservoir for millions of years, but as humans have begun to burn fossil fuels to produce energy and clear natural ecosystems, carbon dioxide is released into the atmosphere, where it acts as a greenhouse gas.
The presence of greenhouse gases in the atmosphere isn’t always a bad thing. It is a natural part of Earth’s climate system and helps to maintain its habitability. Greenhouse gases are relatively transparent to incoming solar radiation, allowing the sun’s energy to pass through the atmosphere to the surface of the Earth. The energy is then absorbed by the Earth’s surface, used in processes like photosynthesis, or emitted back to space as infrared radiation. Some of the emitted radiation passes through the atmosphere and travels back to space, but some is absorbed by greenhouse gas molecules and then re-emitted in all directions. The effect of this is to warm the Earth’s surface and the lower atmosphere. Water vapor (H2O) and carbon dioxide (CO2) are the two largest contributors to the greenhouse effect. Methane (CH4), nitrous oxide (N2O), chlorofluorocarbons (CFCs) and other greenhouse gases are present only in trace amounts, but can still have a powerful warming effect due to their heat-trapping abilities and their long residence time in the atmosphere. Without the greenhouse effect, Earth’s average temperature would be -0.4°F (-18°C), rather than the present 59°F (15°C).
Concentrations of greenhouse gases – and especially carbon dioxide – have risen over the past two hundred and fifty years, largely due to the combustion of fossil fuels for energy production. Since the Industrial Revolution in the nineteenth century, the concentration of carbon dioxide in the atmosphere has risen from about 270 parts per million (ppm) to about 370 ppm. Concentrations of methane have also risen due to cattle production, the cultivation of rice, and release from landfills. Nearly one-third of human-induced nitrous oxide emissions are a result of industrial processes and automobile emissions.
Land-use change presents the second largest anthropogenic source of carbon dioxide, currently contributing up to a quarter of emissions to the atmosphere. When ecosystems are altered and vegetation is either burned or removed, the carbon stored in them is released into the atmosphere as carbon dioxide. The principal reasons for deforestation are agriculture and urban growth, and harvesting timber for fuel, construction, and paper.
Sulfate aerosols and black carbon are two additional important examples of anthropogenic factors. Sulfate aerosols, which enter the atmosphere naturally during volcanic eruptions, are tiny airborne particles that reflect sunlight back to space. Industrial activity has recently increased their concentration in the atmosphere primarily through the burning of fossil fuels containing sulfur. Anthropogenic emissions of sulfate aerosols have been associated with a net cooling effect. Black carbon is soot generated from industrial pollution, traffic, outdoor fires, and the burning of coal and biomass fuels. Black carbon is formed by incomplete combustion especially of coal, diesel fuels, biofuels and outdoor biomass burning. Soot particles absorb sunlight, both heating the air and reducing the amount of sunlight reaching the ground.
How does climate change today compare with historical climate change?
Climate scientists reconstruct the Earth's climate history by studying proxy records including ice cores, corals, and tree rings. These records show natural variability in the Earth's climate such as distinct colder glacial periods and warmer interglacial periods. One particularly well-documented example is the Younger Dryas. Recent human-induced climate change is outpacing examples of historical climate change.
Studying the Climate Record
Climate scientists glean information about past climates by studying ice cores, sediments from the ocean, corals, tree rings, and the geologic record. From these proxy records, they reconstruct Earth's climate history and compare climate changes of the past with observations of recent climate changes and their projections of climate change in the twenty-first century.
Earth's Dynamic Climate
Scientists have long known that the Earth's climate is dynamic, fluctuating between colder and warmer periods generally referred to as glacial and interglacial states (Figure 1). Despite these swings, the Earth has supported life for the past four million years. Historically, climate changes have usually occurred on timescales of thousands of years, although there well-documented exceptions such as the Younger Dryas when climate change has occurred more quickly.
Due to the rapid addition of greenhouse gases to the atmosphere, especially since the Industrial Revolution, climatologists expect to observe greater changes in the Earth's climate over the next century than have been recorded over approximately the past 12,000 years.
Younger Dryas
The transition from the peak of the last ice age around 20,000 years ago to the start of the modern interglacial period (the Holocene) around 10,000 years ago, was interrupted by a sharp return to near-glacial conditions during the Younger Dryas period. This period lasted from about 13,000 years ago to 11,500 years ago. The onset of this cold period took a couple of hundred years, but its termination was extremely rapid (over decades). The strongest cooling during this period occurred in the areas around the North Atlantic Ocean (Greenland, Europe, Western Canada), but its impacts were felt globally, as far away as the Californian coast and China. At the end of the Younger Dryas, ice sheets that had extended down to the northeastern metropolitan region began to retreat and the climate shifted from a glacial to an interglacial state.
The Past 1500 Years
Temperatures began increasing in northern latitudes around 600 AD and warming occurred in other regions up until about 1250 AD due to natural variability in the Earth's orbit. Areas of Greenland were colonized that were previously too cold for food cultivation. This period is sometimes referred to as the Medieval Warm Period, although the warming did not occur on a global scale.
Between 1250 and 1850, a period of cooler temperatures known as the Little Ice Age occurred (Figure 2). Although temperatures tended to be cooler than average, the Little Ice Age was not a continuous time period of colder than normal temperatures because summers were often very warm. Between 1250 AD and the early 1500s, the climate cooled slowly and then appeared to be stabilizing with the exception of the North Atlantic where temperatures began to decrease rapidly. Glaciers that had been receding re-advanced and large bodies of water remained frozen through the summers. Volcanic activity contributed to the cooling during the Little Ice Age. The average temperature during the Little Ice Age was about 1.8°F (1°C) cooler than it is today.
Climate Change in the Twentieth Century and Beyond
In the twentieth century, global temperature averaged over land and ocean areas warmed by 1.08°F (0.6°C) (Figure 3). The rise was not uniform in time or space. For example, temperatures increased in the first part of the 20th century and then decreased between about 1940 and 1970. Also, temperature rise has been greater in the northern high-latitudes. Between 1970 and today, temperatures have warmed, and the 1990s saw some of the hottest years of the twentieth century.
If the current trend continues, temperatures will be more than ~1.8°F (1°C) warmer by 2100 than they were in 1900. However, climate models used by the Intergovernmental Panel on Climate Change (IPCC) project that the climate will warm 2.25 - 10.44°F (1.4 - 5.8°C) in the twenty-first century, outpacing the warming trend of the twentieth century, and at the higher end comparable in magnitude to the temperature swing in the Younger Dryas, when temperatures were only 9-12.6°F (5 - 7°C) cooler than the global temperature today. Therefore, the IPCC projections for the future are within a range of temperatures that could lead to a major climate shift.
What evidence suggests that the climate is changing?
Recent data indicates that near-surface air temperatures and precipitation are increasing globally. In response to twentieth century warming, glaciers have been retreating and snow cover extent has decreased. Arctic sea-ice thickness during the summer and early autumn has declined and tide gauge data show that sea level has been rising. Observational evidence indicates that regional changes in climate have already affected biological systems in many parts of the world.
Temperature, Precipitation, and Extreme Weather
Observed (instrumental) data indicates that global near-surface air temperature has increased by approximately 1.3°F (0.74°C) over the last 100 years (1906-2005). The past eleven years (1996-2006) had some of the warmest recorded temperatures since 1850. Most of this increase has occurred in two periods, from about 1910 - 1945 and since 1976. Minimum temperatures in the latter half of the twentieth century have been increasing at nearly twice the rate of maximum temperatures, reducing the diurnal temperature range in many parts of the world. Increases in daily minimum temperatures are lengthening the freeze-free season in most mid- and high latitude regions.
Instrumental records of precipitation on land show an increase of 0.5 to 1% per decade in much of the Northern Hemisphere mid- and high latitudes. In contrast, over much of the sub-tropical land areas rainfall decreased during the twentieth century.
Over the latter half of the twentieth century it is likely that there has been a 2 to 4% increase in the frequency of heavy precipitation events reported by the available observing stations in the mid- and high latitudes of the Northern Hemisphere. However, the observed record shows no significant change in tropical and extra-tropical storm intensity, and no systematic changes in the frequency of tornadoes, thunder days, or hail events. Furthermore, the reporting of extreme events has changed substantially with time, making a trend analysis difficult.
Glaciers, Lake-Ice and River-Ice
Alpine and continental glaciers have retreated in response to twentieth century warming, although glaciers in a few maritime regions are advancing. Northern Hemisphere lake-ice and river-ice cover over the past century shows widespread decreases in duration, averaging about two fewer weeks of ice cover. Snow cover extent has decreased by about 10% since 1966.
Sea-Ice Extent
There has been a 10 to 15% reduction in sea-ice extent in the Arctic spring and summer since the 1950s and data from submarines indicate that there has been about a 40% decline in Arctic sea-ice thickness in summer or early autumn between the period 1958 to 1976 and in the mid-1990s, or an average of about 1.57 inches (4 cm) per year. Other independent observations show a much slower decrease in winter sea-ice thickness of about 0.39 inches (1 cm) per year. However, it is difficult to assess the influence of the substantial inter-annual and inter-decadal variability on these changes.
Sea-level Rise
Based on tide gauge data, the rate of global average sea-level rise during the twentieth century was in the range of 0.04 to 0.08 inches (1.0 to 2.0 mm) per year, with a central value of 0.06 inches (1.5 mm) per year. Based on the few very long tide gauge records, the average rate of sea-level rise has been larger during the twentieth century than the nineteenth century. Since 1993, sea-level has been rising at an average rate of 3.1 mm per year,
Biological Systems
Available observational evidence indicates that regional changes in climate, particularly increases in temperature, have already affected biological systems in many parts of the world. Examples of observed changes include lengthening of mid- to high-latitude growing seasons, poleward and altitudinal shifts of plant and animal ranges, declines of some plant and animal populations, and earlier flowering of trees, emergence of insects, and egg-laying in birds.
What methods do scientists use to make projections about future climate change and its impacts?
Scientists generally use several models in combination with different emissions and development scenarios to make a range of projections for each climate variable and to construct multiple global change scenarios. These scenarios can be used to get a sense of the direction and relative magnitude of changes in temperature, precipitation, and other climate variables and can help define potentially critical thresholds of climate-sensitive processes. Understanding the range of possible futures helps policymakers and the general public evaluate responses.
Models
Global climate models (GCMs) are mathematical formulations of the processes that comprise the climate system. Climate models can be used to make projections about future climate and the knowledge gained can contribute to policy decisions regarding climate change. An advantage of GCMs is their ability to perform multiple simulation experiments using different greenhouse gas emissions scenarios. A disadvantage of GCMs is their inability to resolve features smaller than about 50 miles by 50 miles. However, as computing power continues to increase, models are being constantly improved.
How Climate Models Work
Computer climate models are the key tool for simulating possible future climates. Though there are many types of models, from simple to complex, three-dimensional global atmosphere and ocean models hold the most potential for making accurate climate projections. These complex and computer-intensive global climate models have been developed to study global climate processes and to create projections of possible future climates. The knowledge gained can contribute to policy decisions regarding climate change and facilitate preparations for future climate changes.
GCMs are mathematical formulations of the processes that comprise the climate system, including radiation, energy transfer by winds, cloud formation, evaporation and precipitation of water, and transport of heat by ocean currents. The model calculations are made for individual gridboxes on the order of 125 – 300 miles (200 – 500 km) in the horizontal and vertical dimensions. The equations of the model are solved for the atmosphere, land surface, and oceans in each gridbox over the entire globe using a series of timesteps.
Projections Made by Global Climate Models
GCMs are used to simulate the climate system's future responses to emissions of greenhouse gases and sulfate aerosols, as well as other human-induced activities that affect the climate system. As of now, GCMs are the only way that we can foresee the effects increased carbon dioxide emissions on global climate. Projections made by GCMs are reflections of the current state of knowledge of the processes in the climate system, but they still contain uncertainties. Figure 2 shows projected changes in temperature and precipitation in the 2050s using two global climate models, one developed by the United Kingdom Hadley Centre and the other by the Canadian Centre for Climate Modeling and Analysis.
Advantages and Disadvantages of Climate Models
An advantage of climate models is their ability to perform multiple simulation experiments using different greenhouse gas emissions scenarios. By performing multiple experiments, with multiple climate models based on multiple greenhouse gas scenarios, the range of possible climate outcomes, as well as the probability of specific outcomes, can be better understood. Model studies can be used to evaluate an area’s mitigation scenarios on reducing the greenhouse effect
A disadvantage of climate models is that, although computer power continues to increase rapidly, global models currently do not resolve features smaller than about 50 miles x 50 miles. This makes it impossible to resolve smaller-scale climate features. The models also simplify or parameterize complex and often non-linear processes, such as the radiation effects of high- and low-level clouds or hydrological processes on the land.
Climate Change Projections: A Flow Chart of Processes
Climate change projections are made based on a flow chart of processes. The flow chart begins with socioeconomic assumptions that affect projections of greenhouse gas emissions and ends with climate system feedbacks and policy. There are different types of uncertainties associated with each level of the flow chart, but the interaction of these uncertainties does not necessarily make the overall outcome more uncertain.
Socioeconomic Assumptions
Assumptions about population growth, economic growth and development, and land-use change affect how quickly scientists think greenhouse gases will be added to the atmosphere. Future emissions of greenhouse gases may occur along a range of pathways related to population and economic growth and technology and land-use change. Relatively fast economic growth and continued use of fossil fuels would lead to an increase in greenhouse gas emissions, while relatively slow economic growth and an increase in the use of alternative energies would lead to a decrease in greenhouse gas emissions.
Emissions Scenarios and Concentration Projections
Figure 2 shows temperatures associated with seven different carbon dioxide (CO2) emissions scenarios. The low end of the IPCC range suggests that in the year 2100 the concentration of CO2 in the atmosphere would be approximately 550 parts per million (ppm), or approximately double the pre-industrial value, while an alternate scenario suggests that the concentration could be close to 1,000 ppm. The other five scenarios fall somewhere in between.
Radiative Forcing Projections
While anthropogenic sources of greenhouse gas emissions are increasing atmospheric concentrations, how the climate system responds to the higher concentrations, as well as to other radiative forcings such as sulfate aerosols and black carbon, is likely to be complex. For example, an increase in temperatures may cause an increase in cloud cover. However, the effect of the additional clouds is uncertain because some types of clouds are associated with a cooling effect and other types of clouds are associated with a warming effect.
Climate Projections
Climate projections depend on emissions scenarios and on how climate processes and radiative forcing are modeled. Climate projections include predicted changes in atmospheric variables such as temperature and precipitation as well as associated changes in other components of the climate system - for example sea-level rise. Temperature projections for the twenty-first century vary depending on the emissions scenario and the model used (Figure 2).
Global Change Scenarios
Climate scenarios and sea-level rise projections can aid scientists as they create global change scenarios and ask questions such as 'How will the future climate change?' 'By how much will global temperature rise?' and 'What will be the consequences?'
Impacts
Impacts are projected based on global change scenarios often downscaled to regional levels. Impacts are projected for water, ecosystems, coastal zones, human settlements and industry, and human health. Projected impacts vary depending on scenario, sector, and region. Changes in mean temperature and precipitation as well as changes in the extremes are important for the projected impacts.
Interactions and Feedbacks
Feedbacks and interactions among impacts, projections, and emissions may amplify or dampen climate change.
Policy Responses: Adaptation and Mitigation
Response to climate change will occur at individual, regional, and global levels. Adaptation responses involve adjusting to climate change whereas mitigation responses involve an intervention to reduce the concentration of greenhouse gases in the atmosphere.
Get printable versions here.
CONTACT US
 > Email