- Home
- About
- Stakeholders
- Projects
- Water
- Evaluating reservoir operations and the impacts of climate change in the Connecticut River Basin
- Collaborative development of climate information for the Connecticut River Basin using Shared Vision Forecasting
- Impacts of climate change on the Massachusetts Water Resources Authority water supply system
- Climate information for water harvesting and re-use strategies in urban settings
- Delaware River streamflow reconstruction using tree rings
- Coasts
- Health
- Cross-cutting theme: Climate
- Cross-cutting theme: Vulnerability/Evaluation
- Water
- Library
- Resources
- Seminars
- Contact Us

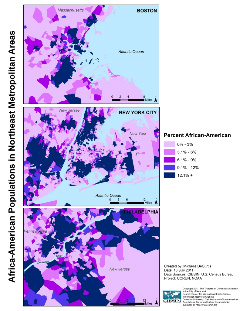
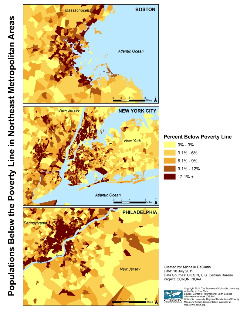
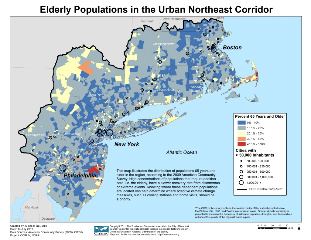
Demographic Maps for the Region
The maps below show the distributions of populations more vulnerable to climate change impacts in the urban Northeast region. It is essential that populations with certain social and economic limitations are identified, and appropriate action is taken to increase their adaptive capacities.
Please click on the maps to see a larger version. Printable maps are available at the bottom of this page.
Printable PDF Versions: 
CONTACT US
 > Email